
README.md 5.3 KB
Pysketcher
Tool for creating sketches of physics problems in terms of Python code.
Purpose
Pysketcher can typically be used to draw figures like
Such figures can easily be interactively made using a lot of drawing programs. A Pysketcher figure, however, is defined in terms of computer code. This gives a great advantage: geometric features can be parameterized in term of variables. Geometric variations are then trivially generated, and complicated figures can be built as a hierarchy of simpler elements. The figure can easily be made to move according to, e.g., a solution of a differential equation.
Here is a very simple figure that illustrates how geometric features are parameterized by variables (H, R, L, etc.):
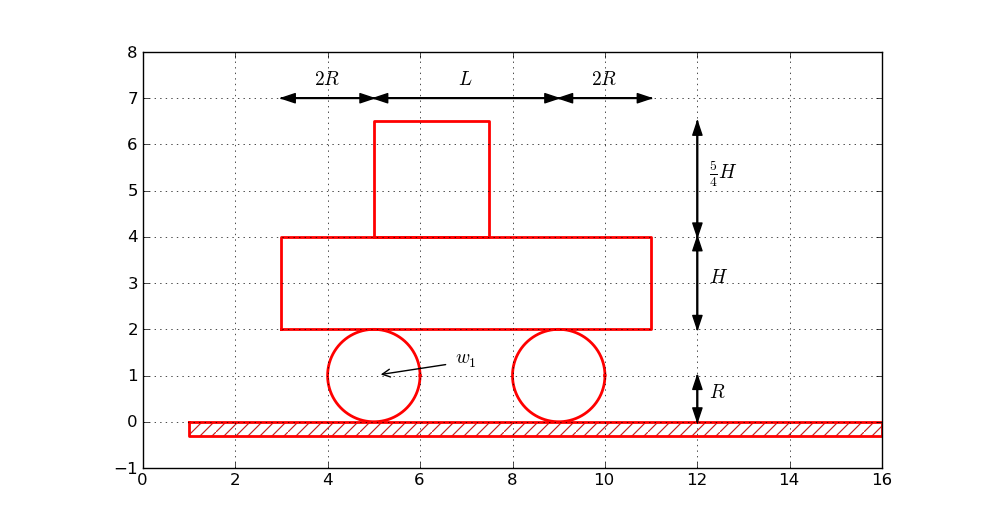
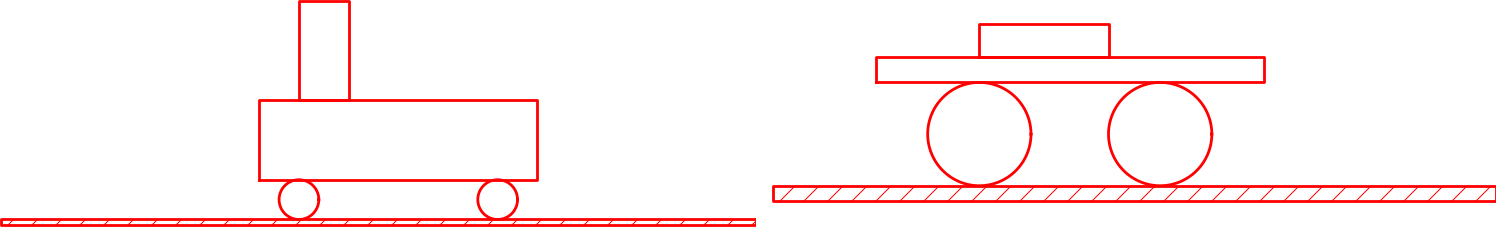
One can then quickly change parameters, below to
R=0.5; L=5; H=2 and R=2; L=7; H=1, and get new figures that would be
tedious to draw manually in an interactive tool.
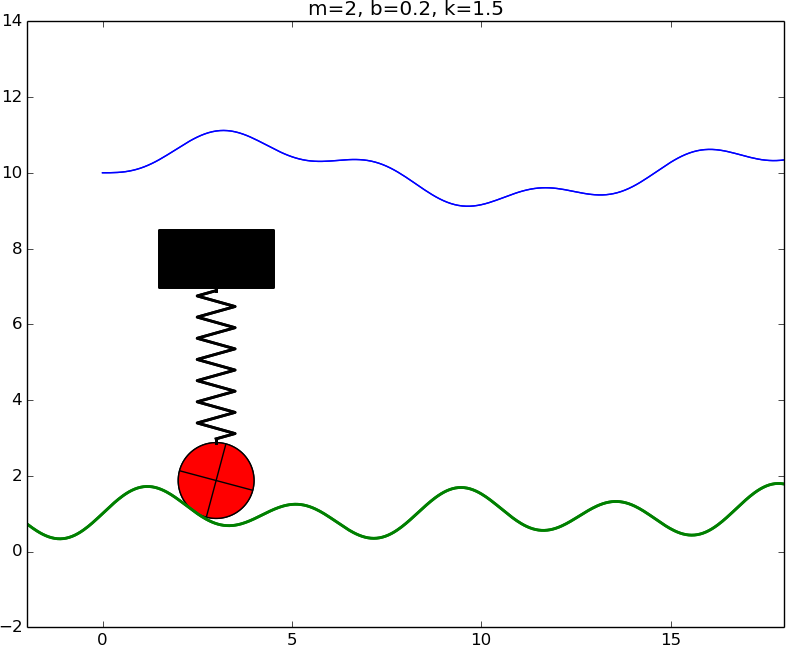
Another major feature of Pysketcher is the ability to let the sketch be dynamic and make an animation of the time evolution. Here is an example of a very simple vehicle on a bumpy road, where the solution of a differential equation (upper blue line) is fed back to the sketch to make a vertical displacement of the spring and other objects in the vehicle. View animation (the animation was created by this Pysketcher script).
Tutorial
For an introduction to Pysketcher, see the tutorial in HTML, Sphinx, or PDF format (or a simplified version of the tutorial in Chapter 9 in A Primer on Scientific Programming with Python, by H. P. Langtangen, Springer, 2014).
Examples
See the examples directory for some examples beyond the more basic
ones in the tutorial.
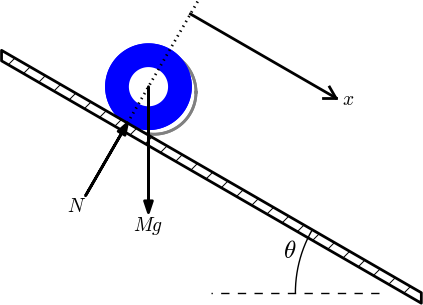
For example, a pendulum and its body diagram,
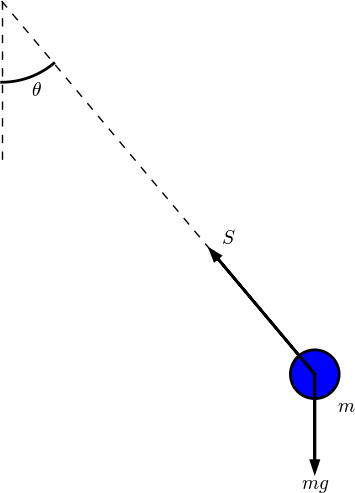
can be created by the program examples/pendulum.py.
Technology
Pysketcher applies Matplotlib to make the drawings, but it is quite
easy to replace the backend MatplotlibDraw.py by similar code
utilizing TikZ or another plotting package. The Pysketcher software is
a thin layer basically constructing a tree structure of elements in
the sketch. A lot of classes are offered for different type of basic
elements, such as Circle, Rectangle, Text, Text with arrow, Force,
arbitrary curve, etc. Complicated figures can be created by sticking
one figure into another (i.e., hierarchical building of figures by
sticking one tree structure into another).
Install
Pysketcher is pure Python code and works with Python version 2 and 3. Just do the standard
Terminal> sudo python setup.py install
Pysketcher demands installation of the following packages:
- Matplotlib (
sudp pip install matplotlib) - Future (
sudo pip install future) - NumPy (
sudo pip install numpy)
The Spline object in Pysketcher also requires SciPy (sudo pip install scipy).
Citation
If you use Pysketcher and want to cite it, you can either cite this web site or the book that has the original documentation of the tool.
BibTeX format:
@book{Langtangen_2014,
  title = {A Primer on Scientific Programming With {P}ython},
  author = {H. P. Langtangen},
  year = {2014},
  publisher = {Springer},
  edition = {Fourth},
}

@misc{Pysketcher,
  title = {{P}ysketcher: {D}rawing tool for making sketches},
  author = {H. P. Langtangen},
  url = {https://github.com/hplgit/pysketcher},
  key = {Pysketcher},
  note = {\url{https://github.com/hplgit/pysketcher}},
}
Publish format:
* books
** A Primer on Scientific Programming With {P}ython
   key:       Langtangen_2014
   author:    H. P. Langtangen
   year:      2014
   publisher: Springer
   status:    published
   edition:   Fourth
   entrytype: book
* misc
** {P}ysketcher: {D}rawing tool for making sketches
   key:       Pysketcher
   author:    H. P. Langtangen
   url:       https://github.com/hplgit/pysketcher
   status:    published
   sortkey:   Pysketcher
   note:      \url{https://github.com/hplgit/pysketcher}
History
Pysketcher was first constructed as a powerful educational example on object-oriented programming for the book A Primer on Scientific Programming With Python, but the tool quickly became so useful for the author that it was further developed and heavily used for creating figures in other documents.